I’ve run into trouble extracting values from the H5 file. I’m currently attempting to read the ‘layer’ value for my surface but I’m unsure on how to retrieve this data from the H5 file.
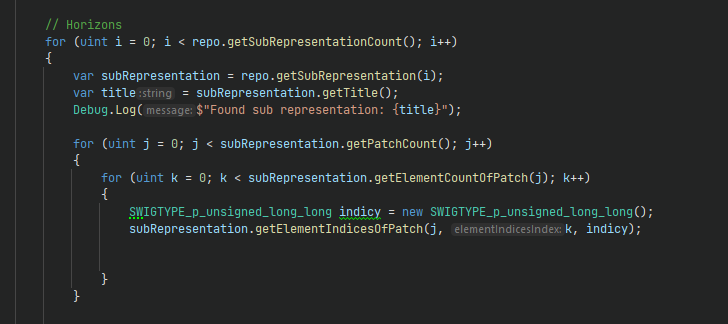
I’ve tried to do something like this but I’m unsure on the correct approach:
However I get the following error on the above:
ApplicationException: The HDF5 dataset /RESQML/20014234-0b34-5926-8617-c5a2ddefdbea/subrepresentation_elementIndices0_patch0 could not be read.
Maybe that is the wrong approach or I have not correctly initialised the H5 file as I have not “opened” it anywhere using the FesApi currently? Is there any example of how to do this?
In your code, you are looking at all different kinds of subrepresentations in the repository (i.e. in the EPC file). Be aware that some RESQML subrepresentations can be totally different than “layer value for a surface”
Looking at your code, the third for loop “getElementCountOfPatch” looks incorrect. Indeed your ‘k’ variable identifies the “element index” but is used as an “element indices index” (I know this is complex to understand and RESQML2.2 will fix that but RESQML2.0.1 behaves like that…).
Looking at the documentation of getElementIndicesOfPatch, I am pretty sure that you actually want k to be always 0 since I would bet that your subrepresentations are not pairwise (you can check with areElementIndicesPairwise). Indeed, this is so complex to have pairwise subrepresentation that I don’t know anybody doing it.
Also, still in documentation, notice that elementIndices must be preallocated “Output array for collecting the indices of the selected elements. It must be preallocated with getElementCountOfPatch() size.”
You can do that as
UInt64Array indicy = new UInt64Array((long)subRepresentation.getElementCountOfPatch(j));
subRepresentation.getElementIndicesOfPatch(j, 0, indicy.cast());
You may want to call “indicy.Dispose()” once you no more need it to avoid waiting for garbage collector to perform native memory release. This is clearly recommended.
Did you check if this HDF5 dataset actually exist?
If you don’t know how, please download HDFView, install it and open the H5 file with it in order to be able to confirm or not what FESAPI indicates to you.
As a side note, FESAPI helps to deal with RESQML but a RESQML knowledge is highly recommended. If you are new to RESQML, be aware that subrepresentation is not the easiest datatype to start with since it is quite flexible and has got a lot of options.
Thank you for taking the time for the detailed reply, that was very informative for me and helped me to make progress.
Yes, I’m still getting familiar with the RESQML format and trying to pick things up as I go. There’s quite a lot to get my head around here so taking some time so I really appreciate the pointers.
I can extract the surface layer correctly and I’m now moving on to rendering the grid model. I’m using the example.cpp as a guide which is helping me understand the correct way to deserialize and interpret the data.
However, I’m having trouble with ‘Faults’. From my understanding, to render faults, I must calculate the points myself from the grid model cells that are “split” (neightbouring cells which have separated points) to then generate my fault mesh. Therefore, faults are “inferred” from the Grid data and not explicitly serialized? Do I have that correct or am I misunderstanding how faults are captured?
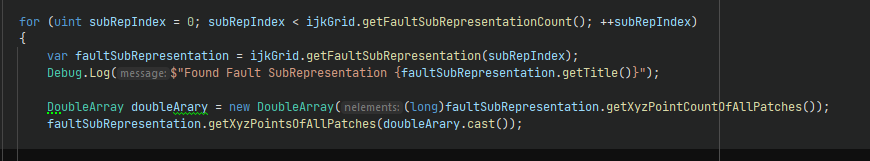
I thought perhaps they would be saved a deserialzied using:
RESQML allows a lot of various ways to capture fault representation. One of them being a subrepresentation of grids (sometimes based on pillar, sometimes based on cell faces, more rarely based on other elements). This kind of export is generally done by Petrel (very common) and Skua (which also supports other kind of fault representation in addition).
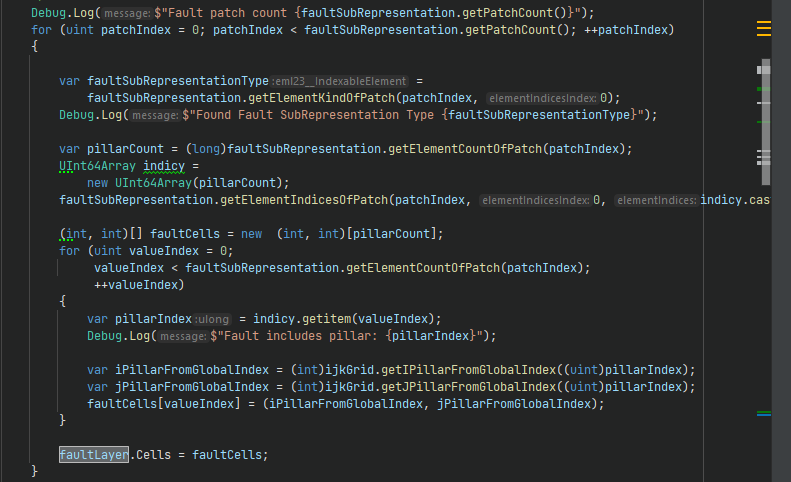
I will concentrate this post only on Fault being represented as subrepresentations of an IJK Grid now that I have explained that faults can be represented very differently (for instance, polyline set i.e fault sticks, triangulated surfaces)
From my understanding, to render faults, I must calculate the points myself from the grid model cells
A subrepresentation relies on existing points (or existing pillar, or existing faces or existing …) so rigorously you have not to recompute these points. You just have to find them according to their indices.
This is what the subrepresentation is done for. It is a collection of index of a particular kind of element of a mesh. You should use [SubRepresentation::getElementKindOfPatch](Fesapi: resqml2::SubRepresentation Class Reference if you want to discover the kind of element your representation relies on.
Once you know the kind of element of your subrepresentation and the index of those elements in your supporting IJK grid, then it is up to you to decide which kind of visualization you want to put in place to highlight those particular elements in your IJK grid.
If you really want to find back the XYZ points of your subrepresentation pillars, yes you would have to filter them from the IJK grid points by yourself. Be aware that FESAPI won’t directly give you that but would help you with some methods such as AbstractIjkGridRepresentation:: getXyzPointIndexFromCellCorner.
If your question was not really about the faults themselves but the way to render your grid where faults happen : this is what we call the split pillars (or split coordinate lines).
You can definitely compute these points by yourself but a pretty good knowledge of RESQML will be necessary since this is not straightforward.
Or, you can directly use AbstractIjkGridRepresentation:: getXyzPointIndexFromCellCorner with loadSplitInformation and unloadSplitInformation. In this latter case, the points computing will be all done by FESAPI to render your IJK grid (it may be slower than a dedicated proprietary computing but generally adopters do not complain)
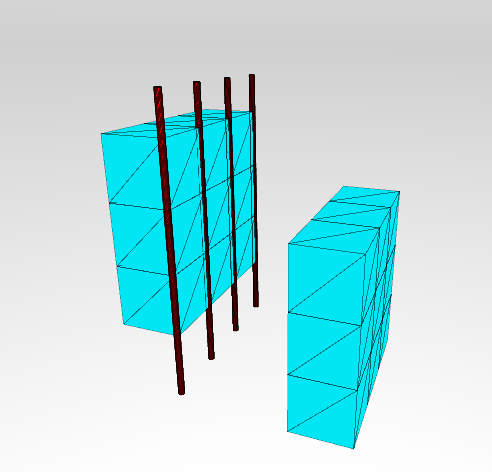
The issue I see is that the “pillar” seems to be only one side of the fault. Or could it be that the I & J cells returned from ‘getIPillarFromGlobalIndex’ are only on one side of the pillar? I would expect to be able to get all neighbouring cells of a pillar (up tp 4 cells) which I could then draw a surface between the “difference” in these split cells.
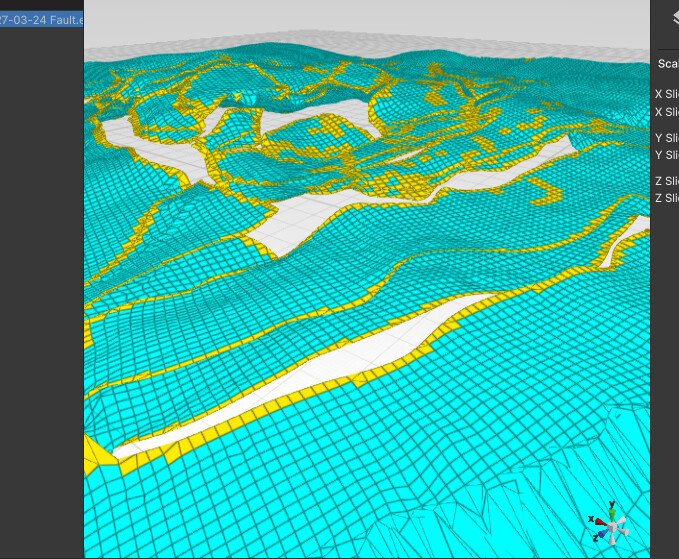
Visually it seems this is the pillar info I’m getting, which in turn returns the cells connected to those pillars:
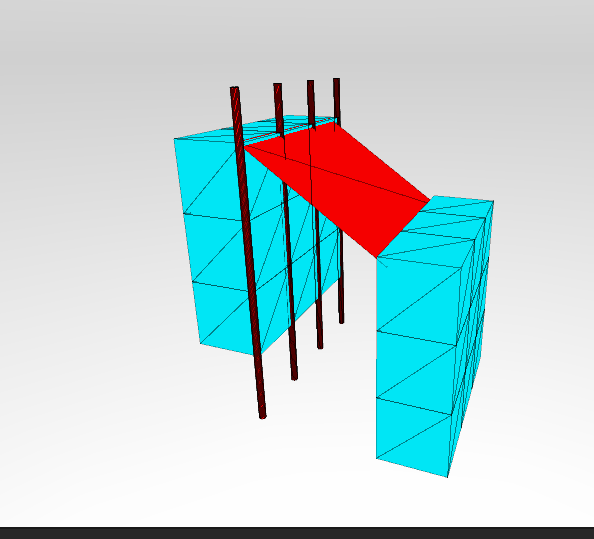
However, I would imagine as a start, I would want both sets of cells (either side of the fault) to be able to render a connecting surface mesh such as:
It seems the Pillars are their own entities with their own set of vertices. With this information it would be simple for me to create the fault meshes as is done in Petrel. However, I’m assuming in Resqml this information isn’t captured as Resqml Pillars are subrepresentations of the cell model?
The returned I (and J) from getIPillarFromGlobalIndex is the I index of the pillar, not the I index of a cell.
If you want the I & J of the incident cell (columns), this is consequently the 4 (I,J), (I+1…J), (I, J+1) and (I+1, J+1) cells.
If you want to filter cells which are splitted (less than 4 potentially), you will have to dive into the RESQML datamodel which is far more complex. This is accessibble through FESAPI but a bit hidden because this is the purpose of FESAPI to hide such functionalities in default case.
If your RESQML grid is a one using a parametric geometry, then you may have such information (top and bottom of straight pillars). You would find that querying control points of a parametric grid.
However, I guess that in the generic case (including explicit geometry) you just want to graphically select pillars by means of cell corners. For that you can locate one cell column using getIPillarFromGlobalIndex and then select corners all along k direction.
My mistake… sorry, I meant :
If you want the I & J of the incident cell (columns), this is consequently the 4 (I,J), (I-1…J), (I, J-1) and (I-1, J-1) cells.
I mixed plus and minus
Sorry I was away from this project for some time and now getting back into it once again.
I’ve debugged the data I’m working with and it seems there is no parametric grid, just an explicit. So I’m guessing the control points are not included in this dataset.
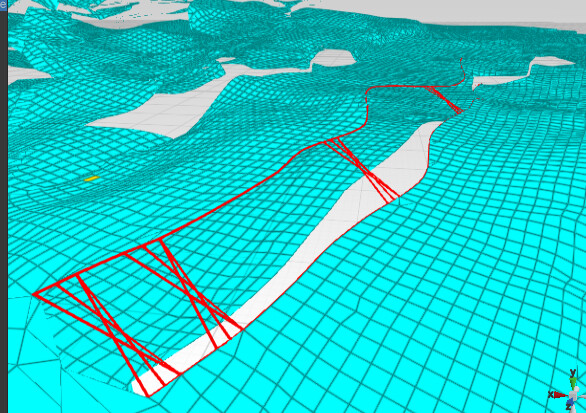
What I don’t get is how to get an accurate point of the fault if you are returning 4 cells that surround the pillar. Would you assume to just take the average of these cells? Currently I’m getting nearest cell then checking neighbouring cells where the points should but don’t match (indicating a fault).
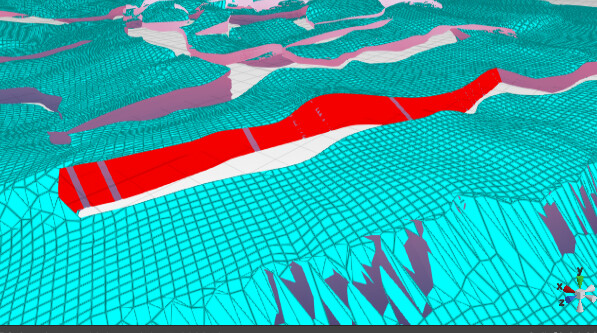
As you can see, it seems I’m getting some incorrect readings based on this approach when attempting to find the edge of the fault (on either side).
Using (I,J), (I-1…J), (I, J-1) and (I-1, J-1) to get the cells from the Pillar global index I get the following which does seem to be correctly identifying the cells on either side of the faults.
What would be the best approach to generate surfaces from this cell data? As in, is there a standard approach as it seems this is the best representation of the fault data you can get from the explicit grid?
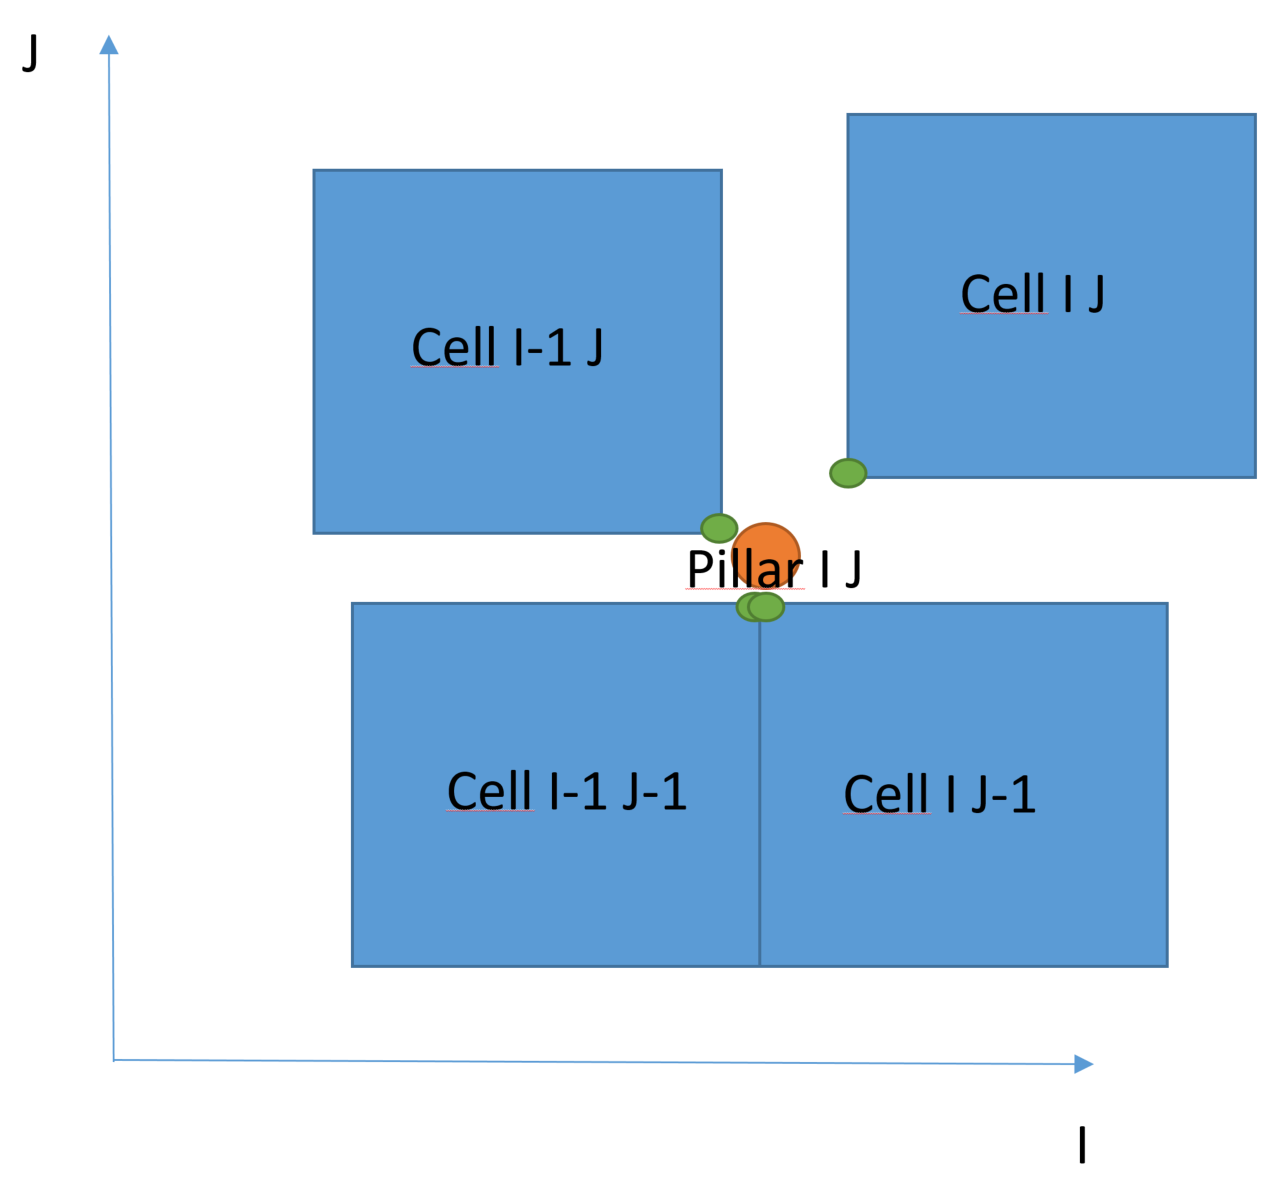
If I would have your use case (which I definitely have not) i.e. “I could then draw a surface between the “difference” in these split cells” or “to be able to render a connecting surface mesh”, I would probably start by getting the 4 coordinate lines (green circle on my picture) for each split pillars on my top K layer using getXyzPointIndexFromCellCorner .
Then I would draw a surface passing through all these quadruplet of points.
As an example :
the top left node green circle would be got by getXyzPointIndexFromCellCorner(i-1, j, 0, 1)
the top right node green circle would be got by getXyzPointIndexFromCellCorner(i, j, 0, 0)
For this solution, we get the split points as you suggested, calculate the top and bottom points and then lerp between these two points based on the layer index. These points are then fed into a NURB surface which generate a nice smooth surface for us.
Once again, we really appreciate all your help on this feature, we couldn’t have done it without your support. Thank you!